From ‘R0‘ (naught) through .. S.E.I.R… to ‘Re‘
In this pandemic, ‘R‘ has leapt from the pages of Epidemiology text books into our social, print, electronic media and everywhere. In the following few lines I have tried to explain few details on the concept of R for my non medical friends. After going through this article, you should be able to know the difference between R0 and Re and how they matter.
In the May ’21, Dame Angela Merkel, the Germany’s chancellor referred to the ‘R‘ factor in Germany’s covid control strategy. Next, Prime Minister Boris Jhonson of UK made the “UK Covid-19-alert” to stand on this single alphabet of R. Since then every Covid-19 news has become incomplete without quoting some R value somewhere. India is no exception.
NDTV news piece quoted below.
All viruses are infectious. Some viruses are more infectious while some are more lethal. For example Rabies virus is 100% fatal. Fatality for Covid 19 is pretty low (2.2%). Yet more people die in Covid-19 than Rabies. Why ?
Because Covid-19 infects more people than Rabies. The capacity to transmit for any virus is measured by a scale known as ‘R’. Within the basket term R we have various subparameters like ‘R0’, ‘Re’, ‘Rt‘.
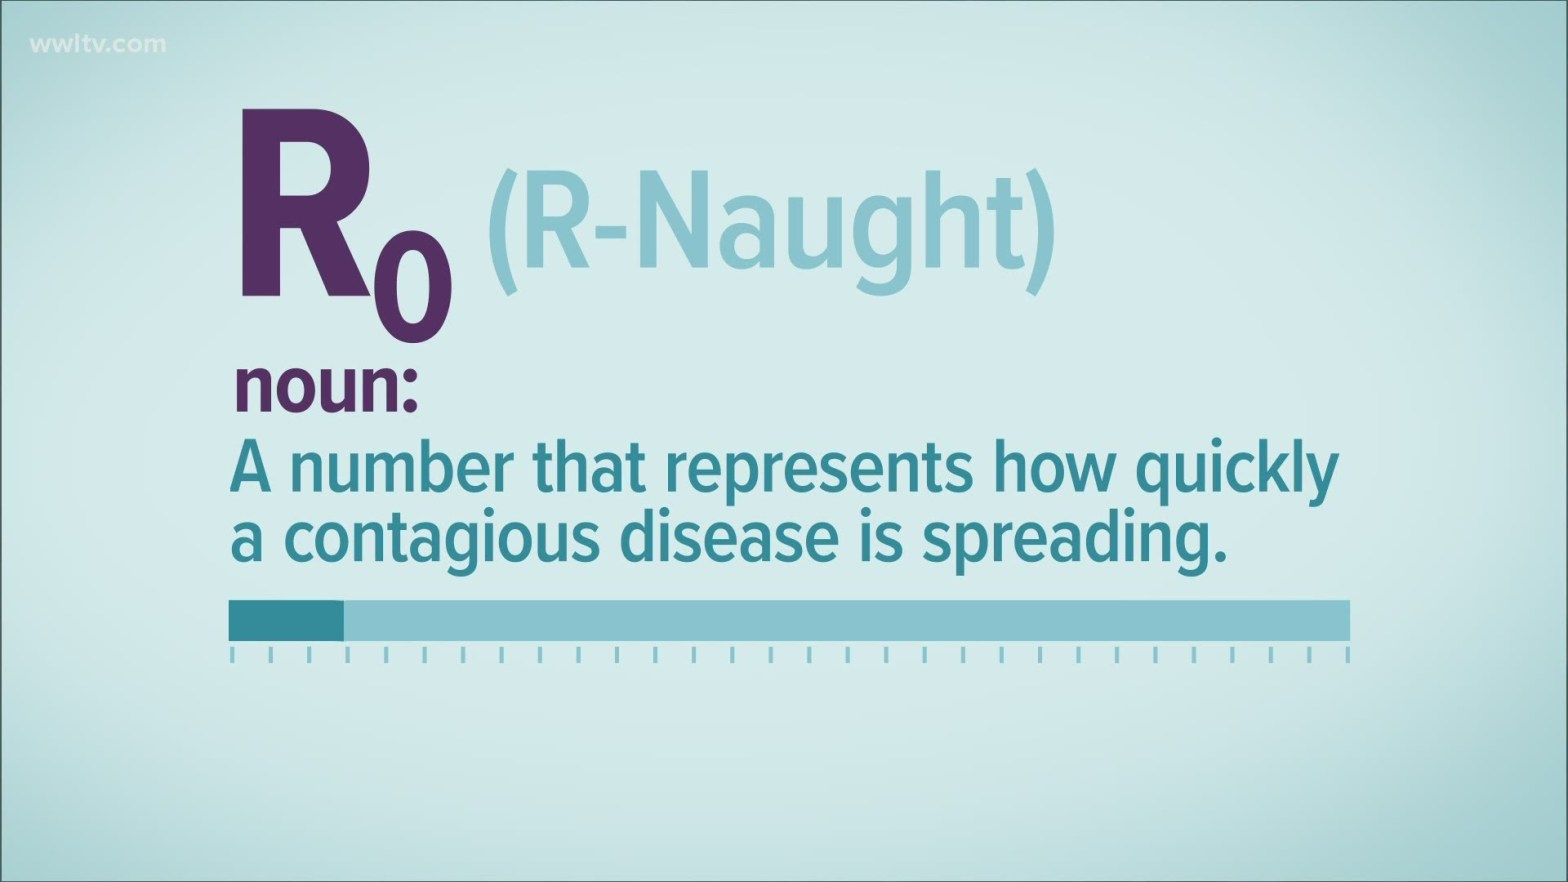
What is ‘R’ value?
‘R‘ is the average number of people that one infected person can pass the virus on to.
The higher the R, the higher the potency of the virus to jump from one case to another. It is highest in Measles. One child with measles can transmit the virus on an average to 10- 15 people. It is pretty low for Covid-19, nearer to 2-3. Why then we don’t have a pandemic of measles, if it is 9 times more infective than thes corona virus ? Because the original R (R0) of a new virus is reduced over the time by so many things. For example,
- Herd Immunity in the community restricts the virus mobility.
- Our Virus Appropriate Behaviour like Social distancing reduces the free movement of the virus.
Thus the Original ‘R0‘ is modified over time to ‘Rt‘ .
After 50 to 60% vaccination level, or strict lockdowns, the effective R becomes pretty low- ‘Re‘. for example on the day this Coronavirus started at Wuhan its RO was only 2. But with the strict lockdown that is only possible and imposed by China, it rapidly fell below 1, and the virus vanished from Wuhan for several months.
The initial R0 of Covid-19 was 1.4 to 2.4 in Nov 2019. (WHO)
Then the virus mutated and its ‘R0‘ got hiked. Wuhan had a new outbreak after months not due to the original virus but by the delta variant. It is also a foregone conclusion that by stringent restrictions the Chinese Government will be able to suppress this new virus .

- R > 1 means the pandemic is growing stronger and stronger.
- R< 1 means the pandemic is shrinking.
- If we can sustain R<1, soon the Infection Curve will be crushed.
- At the end of the Day, all epidemics end, so will be this.
- Epidemiological models can be designed to predict that day.
‘R0‘ can be MODIFIED by OUR COVID APPROPRIATE BEHAVIOUR and VACCINATION.
Several factors like a Super-Spreader Events (Olympic in Japan), Vaccination and Social distancing etc. can decide our exposure ‘E’ . After Recovery form the fever, the person becomes immune to the virus for a certain period ‘R‘. Mathematical models have been created to predict the final transmissibility of a virus taking all such factors. No wonder, the more factors are included in the calculation, the more accurate it becomes. But the formula gets complicated. Today we are going to discuss the simplest and more popular SEIR model in this article. This model guides us in finding a way to reduce the final R (‘Re’) from the R0.
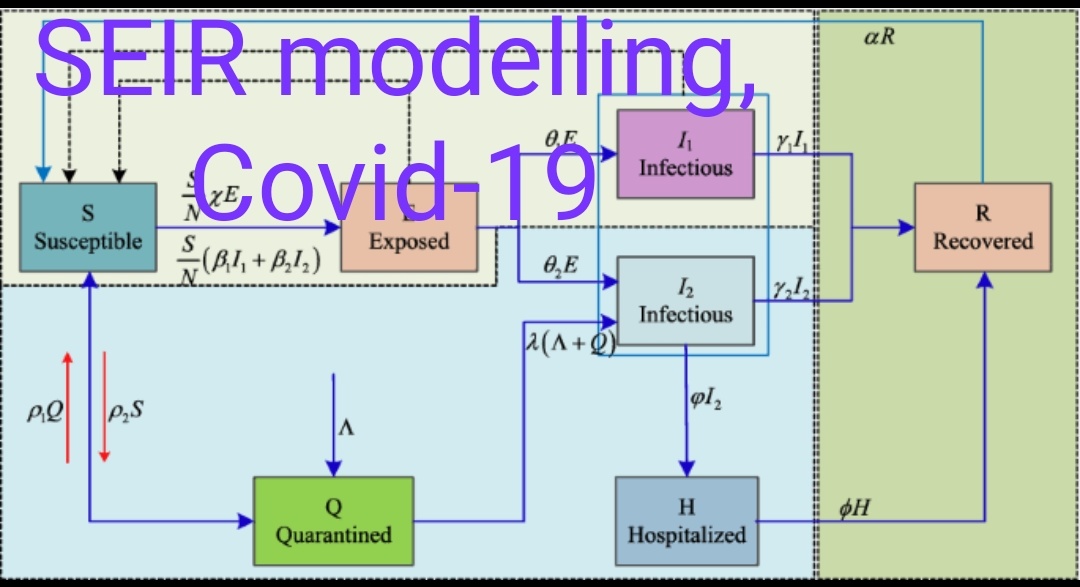
The S.E.I.R. Model
R0
R_naught is the Basic Reproduction Number when no one has developed immunity.
Susceptibility is 100%.
Theoretically, it is possible only on the Day 1, at Wuhan. This was sometimes in the Nov 2019 which the world is never going to know. Neither the identity of the Case zero will ever be known.
The Story So far...
Just Imagine, what must have happened on that fateful day in Nov 2019 at Wuhan, the Day-1 of the Pandemic. No human had experienced the virus earlier, hence no-one has any immunity. Everyone in Wuhan were susceptible to the virus. The susceptibility number ‘S‘ was 100%.
Now our Index case comes out of the lab and goes home. She is without any symptoms. she does not know that she is carrying a biological weapon inside her and can pass on this infection to anyone who comes near her. By the time she gets her first symptom, she has come in contact with 16 people.
Out of 16 we know now that only 6 persons have close contact with the case and the virus had jumped on to them. Of course 4 of them are her own family. These 6 new cases would now start a new chain of E and I numbers and so on.
Thus we have the following table for our SEIR model for Nov 2019.
- S– 100 out of 100 residents of wuhan were susceptible to the virus.
- E – But only 16 of these 100 people are exposed to the virus. ‘E‘ stands for exposure. They were 10 colleagues, 4 family members and another 2.
- I– Infected. Out of these 16 only 6 had close contact. They may have shaken hand or used the same towel. Those who are infected can have any of the several outcome.
- R – After 10 days 4 of the infected 6 would have recovered. These 4 would develop immunity at least for 3 months.
These 6 can be further divided according to their final outcome: Asymptomatic ‘A‘, Hospitalised ‘H‘ or Dead ‘D‘. These are required to calculate the load of the disease on our Health care resources, ICU bed occupancy, fatality etc.
After recovery R, all 6 will develop immunity and will be resistant to the virus for a variable period. ( at least for 3 month)
Now let us come back to the present...
Today, the virus has entered Wuhan for the second time after a gap of 20 months. In these 20 months, the alphabets for Wuhan have changed their numbers. ‘S‘ is no more 100%. The resistance ‘R‘ is modified by past infection and present vaccination of the population. The effective R now is lowered by the r and it is known as ‘Re’. It can be further reduced by our covid appropriate behaviour. For example, though the virus was detected first in Wuhan, but, subsequently with the most stringent social restriction as possible only in China, the epidemic was crushed to zero by the Chinese authority. The R(e) of Wuhan became zero. Then vaccination started. And the virus also mutated and started escaping our vaccines. all these factors are to be taken in predicting the Curve.
Today...
Both the numbers ‘S‘ and ‘I‘ for Today’s Wuhan has changed..
The present R is different from the initial R0 of the original virus of 2019. Both S, I and R (Recovered) stand modified today. In fact china’s largest vaccination drive has changed R too much. So the R today is not the R0. It has a new name R(e) : effective R. The only alphabet under our control is ‘E‘ as we shall see in the next section.
SARS COV2 is different from all other epidemic viruses seen till now.
- R0 for measles is 18. But it does not causes pandemic..
- R0 for the SARS COV1 was 2-3. But it died down before killing more people
- R0 for SARS COV2 is 2.5 (1.8-3.6) but it has already killed 43 lakh people ( Reported).
- Why ?
- How to stop the scourge ?
In epidemiology, even 2 is a very big number for R. R0 =2 means the case numbers in an epidemic double each time. After 20 rounds of infection, it will spread to 10 lakhs new cases.

This SARS COV2 is different from Measles or the earlier SARS. 85% of the Covid-19 infected remain asymptomatic and can pass on the infection to two others. It may be killing less. That means the infected live longer to spread the virus more. Though the R of our Covid-19 is 9 times less than Measles and fatality is 20 time less than earlier SARS, yet it has been successful in killing 43 lakh humans and continuing to do so. It is intelligent enough to increase the ‘E‘ in our model beyond imagination
Unlike the Covid-19, SARS COV-1, the BIRD FLU killed 10% of all infected. It started in 2002 and died down. The second Corona virus epidemic was MERS. It killed 35% of all infected. So it died down before we could know such an epidemic has occurred. So is Ebola. Before vaccine could be created the epidemic died down. When a Virus behaves lethally, it self destroys itself.
In our SEIR model, the best tool to control the ‘E‘ is neither a Drug nor a Vaccine. It has a name –NPI. No vaccine, no drugs can stop the scourge.
Non Pharmaceutical Intervention (NPI) in SEIR model
In the SEIR model E is a virus independent modifiable factor. There are several Non Pharmaceutical Intervention (NPI) tools like Lockdown, Shut down, closure of Public gathering, School and colleges, Non essential business, Non essential Transport, instituting containment zones around clusters of cases are available that can reduce the ‘E‘ , though at the cost of some human right issues.
Restriction of Non-Essential movement of people and closure of Non-Essential business are some of the time tested tools for controlling Epidemics since the Biblical period. The exile of Leprosy cases beyond the urban limits in the ancient Rome is the best example. The Epidemic Diseases act 1897 enforced during the Bombay Plague of 1896 and the present Epidemic Diseases (amendment) act 2020 are such examples. But it was best show cased in a small colony of Saint Louis near Philadelphia for posterity.
The Saint Louis Experiment: Flattening the Curve
One hundred years back when a similar Pandemic was razing the whole world, the health commissioner of a small town near Philadelphia, taught this lesson to its neighbour and more powerful Philadelphia. Several major Outbreaks of viruses have broken out since then. But the Saint Louis experiment of social distancing to flatten the curve of disease still remains the Gold standard in Epidemic control over the whole world anywhere .
The phrase ‘flattening the curve‘ was coined after the success of one experiment during the Spanish Flu of 1918. see the news clip below
Philadelphia detected its first deadly case of Spanish flu on September 17, 1918 in a family of 7. But Philadelphia was busy observing USA’s victory inWorld War 1. A massive gathering of citizens for observing the Victory day parade has been officially organised. The health commissioner of the nearby Saint Louis on the other hand closed down all movie theatres, churches, schools, prohibited public gathering, stopped all non essential business and imposed travel restrictions for the month of October. The results were dramatic and visible. Death and illness due to Spanish Flu in Saint Louis were drastically lower than that in Philadelphia. Unfortunately, by the time Philadelphia imposed these measures, it was too late. Since then Non Pharmaceutical Interventions have become the mainstay in controlling every respiratory epidemics.
By Covid appropriate behaviour ( Social distancing, mask and sanitiser use) we can reduce the effective R much below the R0. The virus will mutate in future. But it is in our power, whether such mutant can run a pandemic in the future.
